
NASA Langley Research Center - SBIR Phase I Contract & Newport News Ship Building - Research Contract
The objective of this project was to simulate low-speed, turbulent aerodynamic flows using the Vorcat implementation of the three-dimensional, viscous vortex method. Vorcat represents a fundamentally different methodology for turbulent flow prediction compared to traditional RANS and LES techniques, which have been developed within the sphere of computational fluid dynamics (CFD) over many years.
After several consultations with the technical monitor and the Computational Modeling and Simulation Branch at NASA Langley Research Center, it was decided that a useful test of the capabilities of Vorcat lies in the simulation of the flow in a tripped flat-plate boundary layer at Reynolds number 200,000,and the flow past the benchmark 30P30N multi-element foil at Reynolds number 9,000,000.
In order to perform the simulations, Vorcat has been extended to include periodic boundary conditions (span-wise) and the visualization tool has been modified to include the relevant geometries.
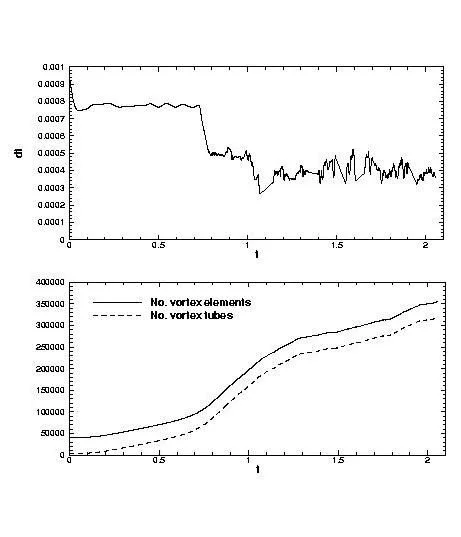
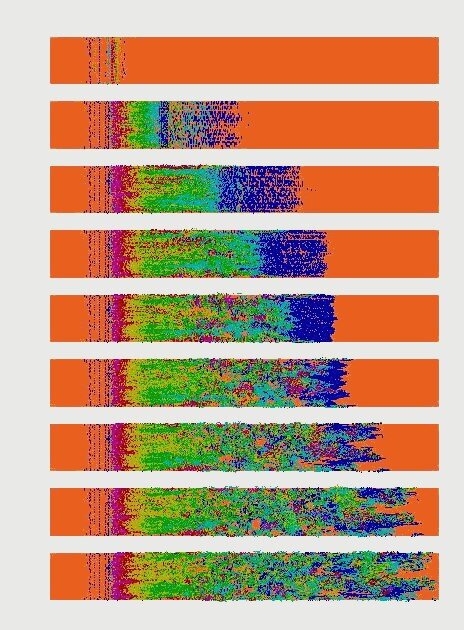
Images 1-6 describe several aspects of the flow field as it develops over a tripped flat plate at Reynolds number 200,000. Images 1 and 2 show snapshots of the computed vortex element population from the top and side, respectively, at a sequence of increasing times. Images 3 and 4 give a magnified view of the flow from each of these perspectives. Image 5 includes a close-up view of the vortex elements in a part of the transition region and Image 6 depicts a typical eddy in the turbulent boundary layer. Image 7 shows the number of vortices in the calculation as a function of time, as well as the time history of the time step.
After t = 0.75, the number of vortex elements increases more rapidly and the flow transitions from the initial laminar state to turbulent flow. The numerical time-step reaches a quasi-equilibrium value of about 0.0004, while the number of vortex elements starts to level off after t = 2.
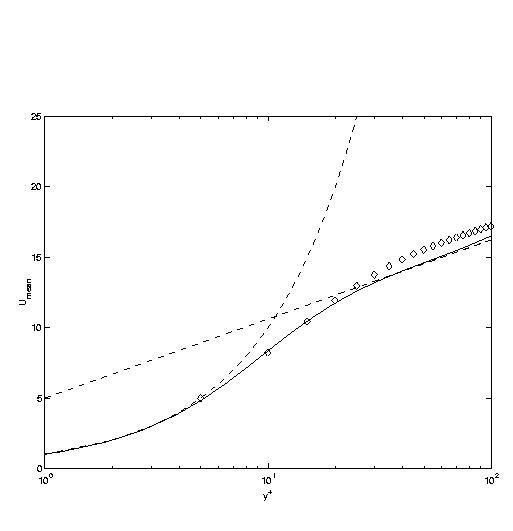
Images 8-10 display turbulence statistics of the flow over the flat plate. The mean velocity profile, U+ displayed in Image 8, is compared with the standard log law result U+ = (1/.41) log(y+) + 5, the near wall relation U+ = y+, and the Spalart mean velocity DNS solution for R? = 670. The latter is appropriate since a calculation yields that R? = 575 for the Vorcat simulated boundary layer at x = 1.1. It may be noted from the image that the computed U+ field displays a log law behavior with the correct slope, and a slight overestimation of the magnitude. It is most likely (a conjecture we hope to conclusively establish in the near future) that such quantitative discrepancies are the result of the limited sheet mesh resolution of the current simulation and the lack of sufficient time averaging. It should also be pointed out that other sources of error have yet to be fully identified, e.g., parametric studies of the effect of numerical parameters such as tube length have not been completed. Moreover, a number of enhancements to the computation of the velocity from the wall sheets will be implemented in the near future.


Results
A plot of the normal Reynolds stresses is shown in Image 9. While there are some quantitative differences with the DNS solution, the degree of agreement is quite significant, particularly in view of the aforementioned resolution problem. The collective behavior of the normal stresses is revealed in the plot of turbulent kinetic energy shown in Image 10. As before, the results are suggestive of the effectiveness of the vortex method calculation. Finally, the prediction of Reynolds shear stress is also indicated in Image 10. The quantitative accuracy is similar to that in the normal stresses. It is significant that a definite shear stress of the correct sign and magnitude appears as part of the vortex method solution. This confirms the presence of a correct physical organization to the flow, i.e., the Reynolds stress and its attendant momentum exchange are not likely to be correctly predicted without capturing the true physical structures and their dynamics.
A visualization of the vortex element distribution on the 30P30N foil at time t = 2 and angle of attack ? = 19o is displayed in Images 12 and 13, from a perspective above and below the airfoil, respectively. Vortex filaments are colored according to their circulation strength: red being the strongest and blue the weakest. An early-time prediction of the distribution of the pressure coefficient Cp for ? = 8o vs. experimental data, is shown in Image 14. The qualitative agreement between curves is encouraging and suggests that the Vorcat solution is on track toward capturing this complex flow field.
This project leads us to conclude that both the boundary layer and airfoil calculations appear to be on course toward establishing the qualitative and quantitative accuracy of the Vorcat scheme. Pending funding, final results of these studies should be reached in the future. Extensions of this work to 3D wings or foils with partial flaps are anticipated.
RE: Peter Bernard and Athanassios Dimas, Vortex Method Modeling Of Complex, Turbulent Engineering Flows, Proceedings of The Second International Conference on Vortex Methods, Sept. 26-28, 2001, Istanbul, Turkey.