

Ford Motor Company
The unique software VorCat, which is based on a fast parallel vortex method, was employed to perform a time accurate simulation of the flow in a pressure regulator spool valve from an automotive automatic transmission.
The spool valve experiences flow forces, which affect its axial motion and radial clearance. In this work, detailed flow field information, including velocity, vorticity, and pressure distributions were computed for spool valve openings of 1mm and 0.25mm. The predicted velocity results agree well with corresponding experimental measurements, while the predicted vorticity results correlate well with experimental pressure measurements.
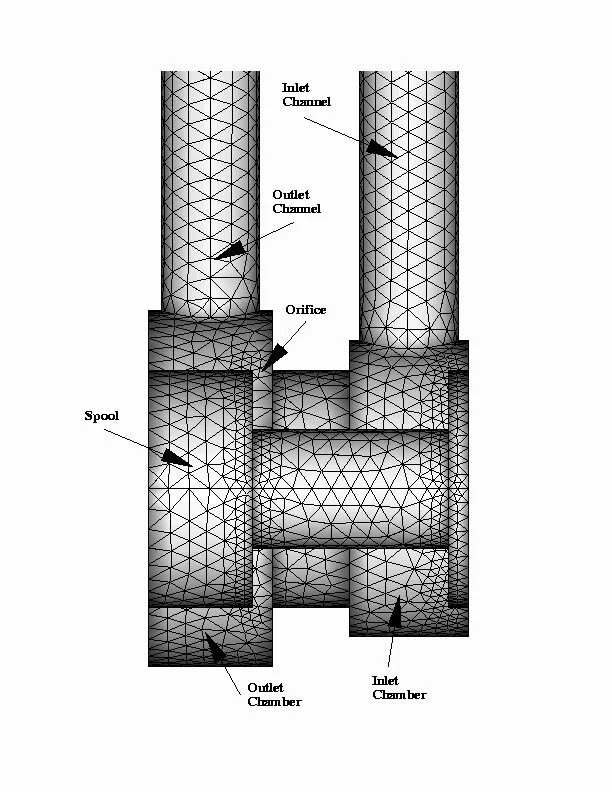
A cross-section of the valve is shown in Image 1. The flow through the spool valve configuration was studied for three conditions: (1) flow with an orifice opening of 1mm, (2) flow with an orifice opening of 0.25mm, and (3) reverse flow with an orifice opening of 1mm. In the reverse flow conditions, fluid enters from the outlet channel and exits from the inlet channel. In all cases, the influx rate is 40l/min resulting in an average influx velocity of 34m/s.
The Reynolds number based on the average influx velocity and the inlet/outlet channel diameter of 5mm is 8833. The triangularization of all the valve surfaces consists of about 8500 triangles. All computations were performed on an Origin2000 and a T3E, both machines belonging to the Cray Corporation. The computational time was about 20 seconds per time on 32 Origin2000 processors, and about 1 min per time step on 32 T3E processors. Each run required about 8,000 time steps for the flow to reach a non-dimensional time of 2.


Results
Images 2 and 3 display wall pressure and velocity (magnitude) distributions, respectively, in the outlet channel and spool surface. Many other detailed results are described in the publications listed above. The most important conclusion is reflected in Image 4, which displays force computations performed by VorCat compared to experimental results as well as other two CFD technologies predictions. Clearly, the VorCat predictions compare very well with the experimental data. Other two numerical predictions (PowerFlow abd a RANS code used by Mazda researchers) display large inconsistencies, in particular for the smallest spool valve opening. Image 4 compares Flow Force on Valve Spool as computed by VorCat and other CFD technologies as well as experimental recordings.
RE: Athanssios Dimas, Isaac Lottati, Gary Strumolo, Ronald Miller, and Peter Bernard, Turbulent Flow Forces on Hydraulic Valves: A Parallel Vortex Simulation Method, Proceedings of the ASME Fluids Engineering Division, FED-Vol. 253, 553-558, Editor: T. J. OHem, 2000.