
U.S. Defense Threat Reduction Agency
The objective of this Small Business Innovation Research Phase I project was to devise accurate techniques for predicting turbulent mixing with a view toward estimating the effectiveness of strategies for neutralizing bio/chem hazards.
Substantial progress by Krispin Technologies, Inc. in developing 3D vortex methods for turbulent flow simulation as part of a DOE supported SBIR Phase II project was leveraged to yield immediate application to realistic hazard scenarios of interest to DTRA. Among these are scalar plumes emanating from multiple sites within confined or open-air domains.
The unique capabilities of vortex methods derive from the versatility of their grid-free character; their computational speed; and, their capacity to represent essential physical properties of turbulent flow.
In particular, they are better positioned to model the essential effect of small-scale vortices on scalar mixing than traditional grid-based closure and large eddy simulation techniques relying on unphysical diffusive models.
The accuracy of the methodology was tested for scalar plumes in atmospheric flows under a variety of conditions as well as for turbulent jets. Subsequently, methods for quantifying mixing between species were devised and they can be applied to problems for which scalars originate from separate sources.


Results
The first image describes two starting up jets about to collide with each other. Both jets were seeded with particles with initial positions indicated by the figure. One can see that as the vortices passed by they shot some particles to the sides while others are entrained in the vortex. The two start-up vortices are tilted by their mutual interaction. The second image shows the jets crashing into each other and the particles starting to mix. Each jet contains 500 particles, though only 50 are plotted.
The next images (numbered 3 through 9) depict a simulation consisting of two species interacting with frames recorded every 40 time steps. The two images in each frame are the same scene viewed from the side (x,y) and end-on (z,y). The particular case shown has the side jet running from 0 to .1, while the vertical jet is also turned on at 0, but is not turned off. The vertical jet becomes turbulent before the side puff hits it.
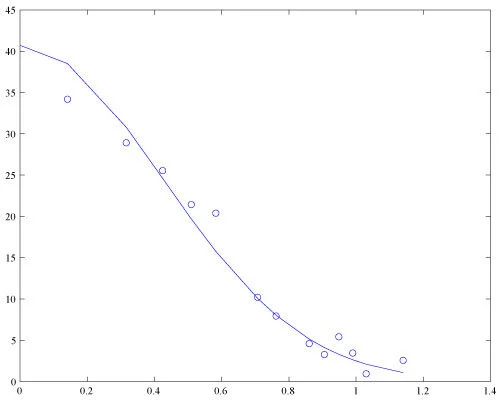
In this study, the simulated jet flow gave much evidence of conforming to classical results, despite the limited nature of the simulation (i.e., results are obtained within 4 diameters of the orifice). For example, as shown in image 10,the radially averaged axial velocity was compatible with the theoretical Gaussian similarity structure. Also in agreement with experiments were the similarity-rule parameters (not shown here). Other statistics, such as rms Reynolds stresses, and the overall structure of the computed jet (e.g., breakdown of unstable vortical modes near the orifice) are compatible with experiments as well.
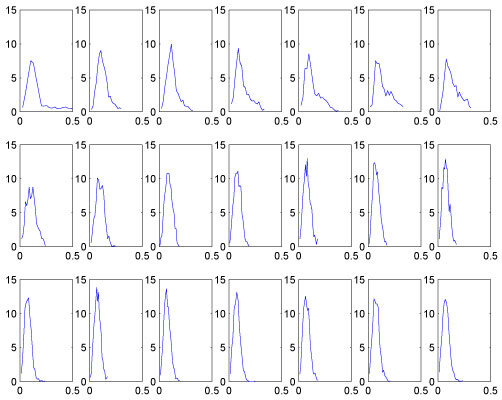
The standard approach to quantifying mixing between two species is via local or global formulas based on the differences between the concentrations of the two species. The idea is that when the species are mixed some quantities based on concentrations will vary minimally throughout the flow. However, such formulas are not well suited to Lagrangian descriptions of the contaminant species. Instead, statistics based on the pdf of closest distance between particles of the two species is readily implemented and interpreted physically for the two species case. In particular, we used a formula that describes the closest approach of any of the blue particles to the particular red particle. Image 11 describes pdf of minimum distance of red particles from blue particles. From top to bottom and left to right, time varies from 11 to 15 in intervals 0.2. The pdf corresponding to our selected formula gives a wealth of information about the mixing. In Image 11, the general steepening of the curves and their movement to smaller distances is evident. The behavior of these curves (e.g., their mean) in time can be correlated with the visual depictions and used to judge the degree of mixing, as when and if the mean separation asymptotes to the effective radius of the particles of the red species.
This example illustrates the intrinsic advantages of the purely Lagrangian formulation provided by VorCat. By giving a direct and detailed representation of the underlying turbulent structure of the jet, VorCat makes it possible to invent original and powerful new means for understanding and assessing the physics of flows including mixing of contaminant species.
RE: Peter Bernard, Mark Potss, and Jacob Krispin, Studies of Turbulent mixing using the VorCat Implementation of the 3D Vortex Method, AIAA 2003-3599, 33rd AIAA Fluid Dynamics Conference, Orlando, FL, 23-26 June, 2003