
Floating Offshore Wind Turbines (FOWTs): Analysis of turbulent wake interference
Vorcat, Inc. studied the complex wake interactions between two FOWTs wherein the rear turbine is placed downwind relative to the front wind turbine. The focus here is on the following:
The heave motion effect of a FOWT on the flow in its rotor wake
The effect of a FOWT on the wake of another FOWT downstream
The rear turbine performance
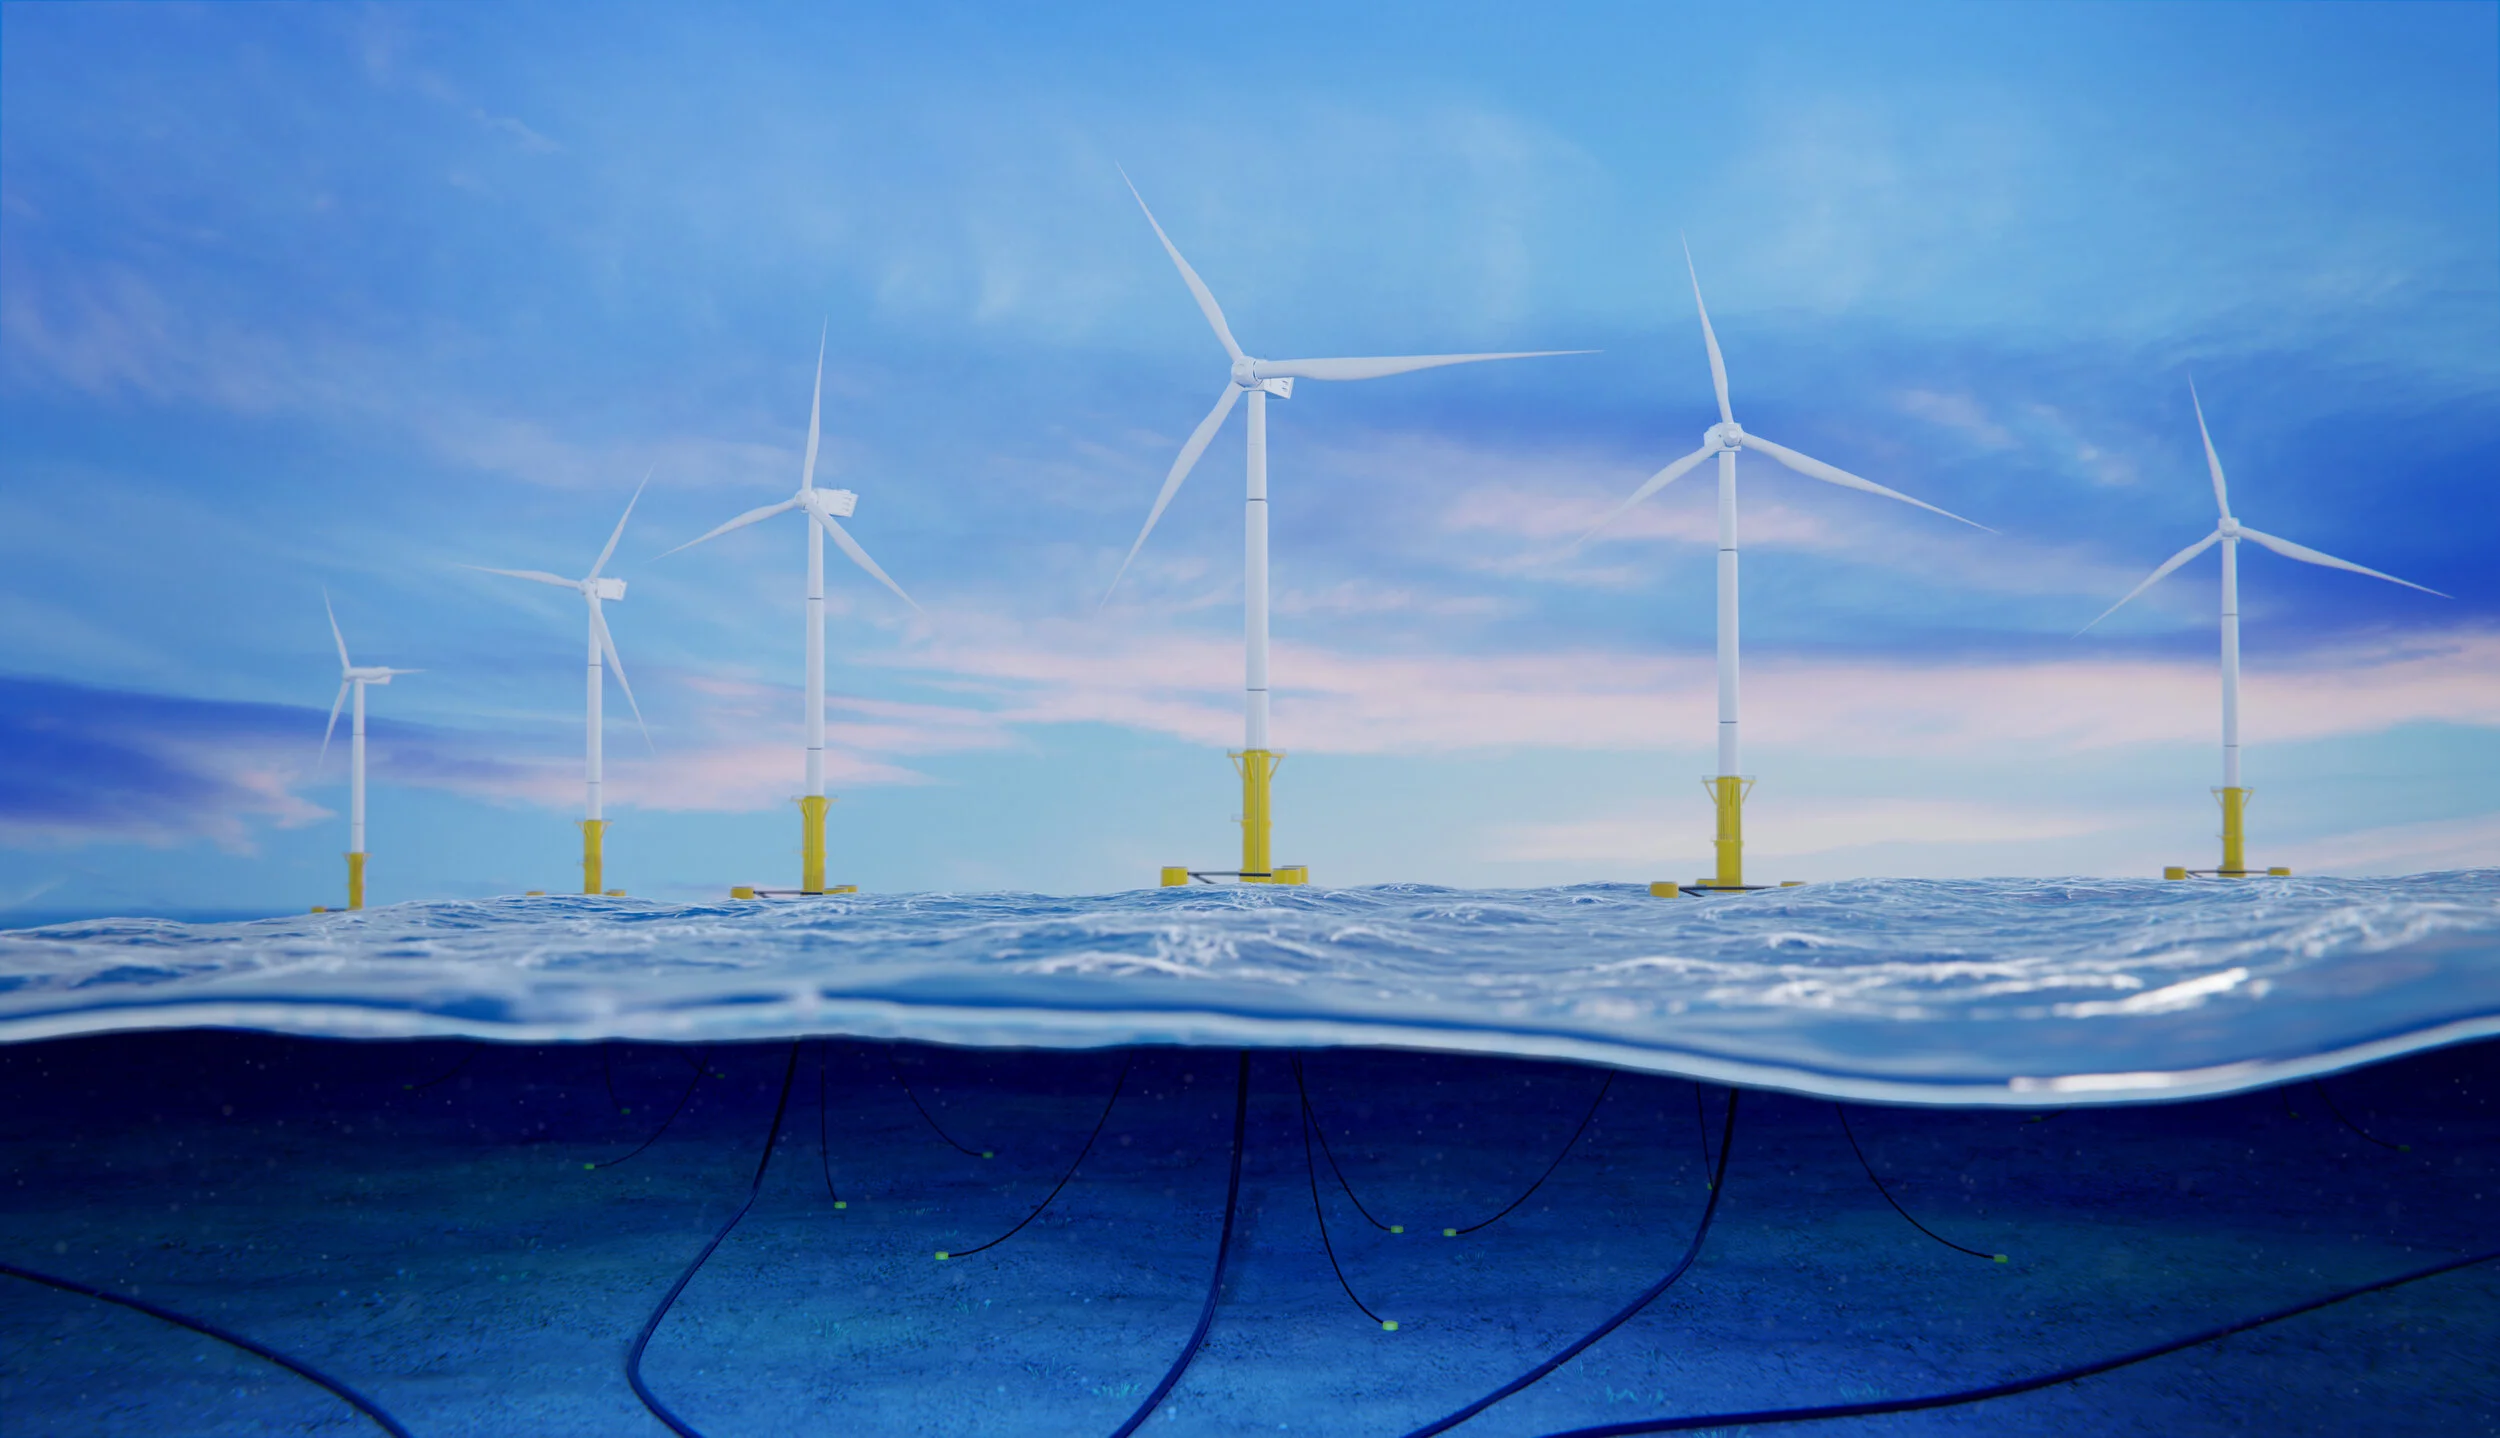
Problem setting (see sketch on the right) and assumptions made:
Blade/Rotor actuator line model is based on NREL OC3-Hywind platform (Jonkman 2010) 5MW turbines with rotor diameter D=126 m, rotation speed 12.1 rad/sec, tower height 90 m above the mean sea level, while the distance between the FOWTs was 750 m. (Jonkman, J.M. (2010). Definition of the Floating System for Phase IV of OC3, TP-500-47535. Golden, CO: National Renewable Energy Laboratory.)
The wind speed was U=20 m/s, the wave height was H=3.5 m, the wave period was T=6.3 s, The FOWTs were allowed to execute a heave motion under wave loading, where the corresponding Response Amplitude Operator (RAO) was considered to be RAO=0.5.
The sea surface is assumed inviscid and no viscous surfaces are present here. Also, the incoming wind speed is uniform (viscous effects, boundary layer, and other physical phenomena will be included in future studies).
Results:
(i) All lengths are non-dimensionalized by the rotor radius, R=63m.
(ii) All velocities are non-dimensionalized by wind speed, U=20m/sec.
(iii) Time is non-dimensionalized by R/U.
(iv) Available wind power is non-dimensionalized by the power at the front rotor plane.
(v) Rotors are placed at (non-dimensional) X=0 and 12.
(vi) All animations are recorded over the simulation (physical) time of 0 -3 minutes (time steps 0 - 1080).
(vii) Tubes are removed when reaching a distance of X=30.
(viii) Waves are described by the normal velocity imposed on the surface, high velocity in red, low velocity in opaque.
Flow dynamics, evolution in time of flow variables.
(i) Tubes
(ii) Velocities recorded on cross sections, spaced 2R apart, along the rotors wakes. 1st plane and 7th plane from left are placed at front and rear rotors, respectively. Top - total velocity, bottom - x-component.
(iii) Total vorticity recorded on cross sections, spaced 2R apart, along the rotor wakes. 1st plane and 7th plane from left are placed at front and rear rotors, respectively.
2. Turbulence Statistics
(i) Statistical equilibrium (convergence) data: number of tubes and splits vs. time step


(ii) Turbulence Intensity at the rotor centerline at different distances along the wakes, from top to bottom: X=0 (front rotor), X=6, X=12 (rear rotor), X=18


(iii) Available Wind Power P (P0=1) and Available Wind Power Gain (AWPG=(P-P0)/P0))

Comments on Results and Conclusions
In the context of assumptions made, the code shows convergence after 2.5-3.0 minutes of flow.
The results follow the theory and observations: (i) the available wind power drops along the first rotor wake and rises when the two wakes collide, causing a large growth in turbulence kinetic energy and turbulence intensity, which in turn produces an uptick in available wind power at the second rotor, that translated to a gain of a few percent points at that rotor.
The particular heave motion imposed on a FOWT is introducing a variation of the velocity field just upstream and downstream of the FOWT rotors. The variation follows the frequency of the heave motion but its amplitude is rather small, i.e. less than 2% of tip speed.
The flow in the wake of the 2nd FOWT is affected by the presence of the 1st one; the maximum mean turbulence intensity in the wake of the 2nd FOWT is increased by 30% compared to the one in the wake of the 1st FOWT.
This run took 10 hours on 4 nodes of Cori (NERSC cray platform, 32 cores per node) to complete. The code is scalable to thousands of cores.
It is shown that no calibration or empirical parameters are required, all problems are treated the same in Vorcat. The quality of the results depend on the data quality of the rotor blade.
In the near term, the code will be extended to include additional physical phenomena, ranging from viscous surfaces (sea waves, tower, etc.), to more general motion of the tower, heat effects, etc.
