

Studies of various Automotive flows using the Vorcat software
Vorcat, Inc. has applied the Vorcat code to several Automotive flows over the years. In addition, several joint projects with partners and customers have addressed automotive flow problems.
Summaries of a subset of cases that do not include proprietary data are described below. More detailed information regarding these studies can be found in Vorcat publications and technical reports.
The Cronuz Configuration (in collaboration with IDIADA)
Ongoing study – results to be published after completion.

MIRA Geometry
(In collaboration with IDIADA, results courtesy of IDIADA, taken from M.Sc. Thesis of Mr. Xavier Ballesta )
The Ahmed Configuration
250 base slant angle
Re=500,000
Inviscid ground plane
Front: x=0
Back: x=1

Side

Top

Front

Rear During Startup

Ahmed Body with 30° base slant angle

Ahmed Body with 12.5° base slant angle

U on centerline

U on centerline

U on window, x = 0.8678

K on centerline and wake
The Morel Configuration (JSAE paper)

Boat Tail

Square Base
Simulations
Length: Height: Width = 4.1:1.0:1.4 (BT)
= 3.6:1.0:1.4 (SB)
Reynolds number = UL/n = 20K,100K, and 213 based on height, L = 1.0
Number of triangles: 13,962 (BT) and 14,518 (SB)
Sample runs (strongest vortons and velocity contours shown): depiction of separation and flow evolution at the base of the configurations

Cd. Vs. Time
Analysis:
Morel Flow Compared with Boundary Layer Flow Reynolds number = Ux/n = 20,000 (based on height).
Top & bottom surfaces of Morel-BT Averaging over 9 data sets (Time steps = 600 – 1,300)
7 spanwise positions and 9 streamwise locations Comparisons with Direct Numerical Simulation (DNS)
(Flat Plate BL, by Spalart)
Averaged Reynolds Shear Stress and Turbulent Kinetic Energy


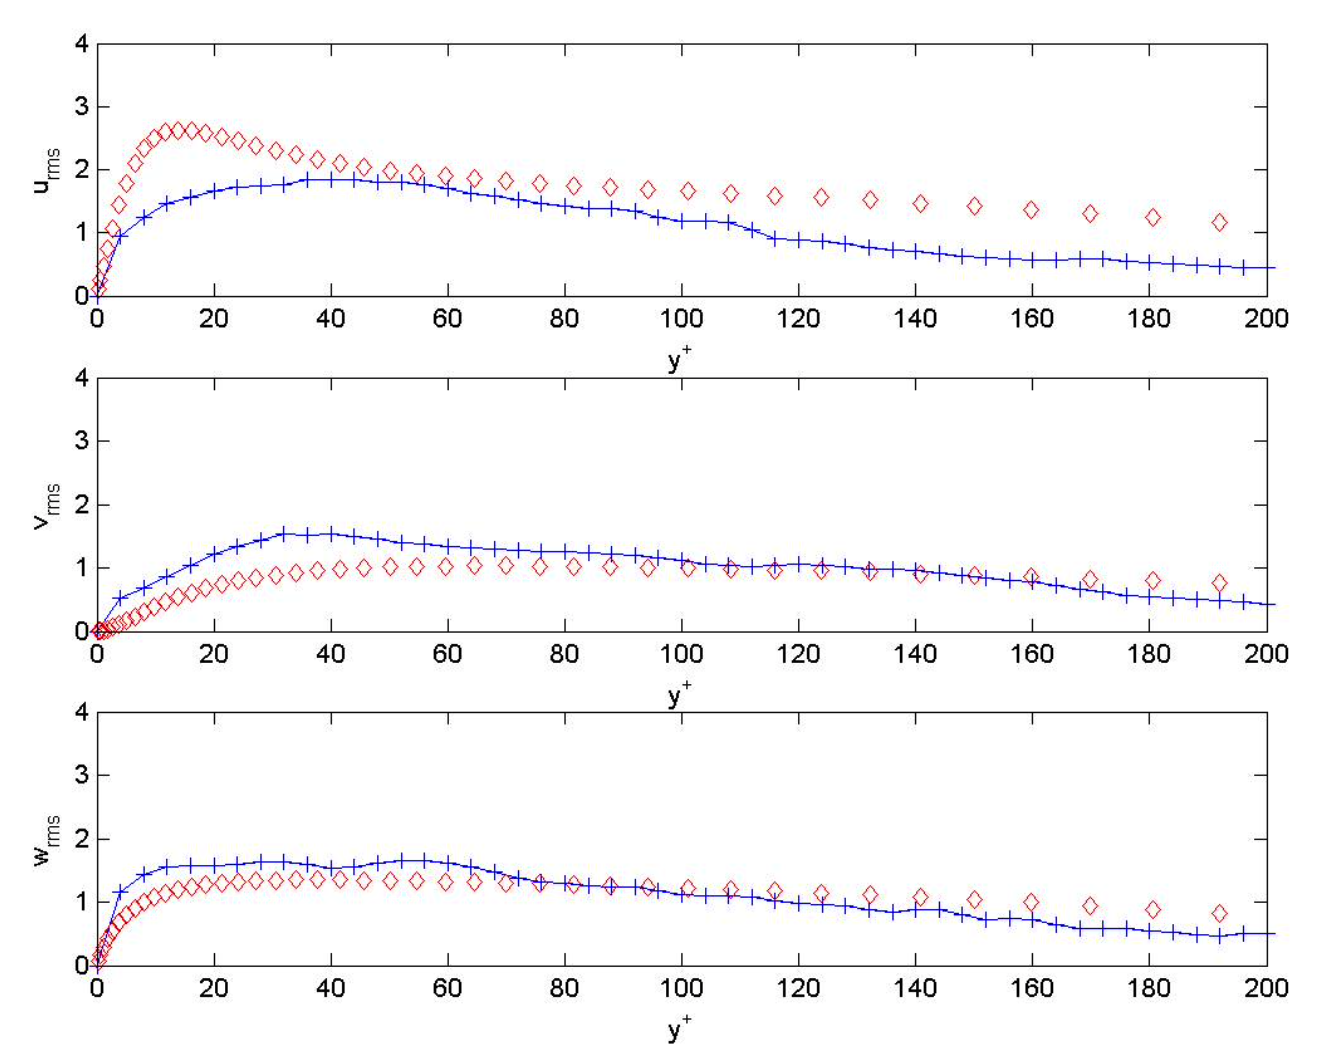
RMS Normal Reynolds Stresses
Mean Velocity: comparisons with log law, near wall relation, and DNS (Spalart)

Mean Velocity vs. Displacement Thickness (δ)

Mean Velocity vs. Momentum Thickness (Ө)

Hydraulic spool valve (Ford Motor Company)

The geometry

Velocity contour
Comparison of Vorcat force results with experiments and other CFD codes

Conclusions:
Vorcat results show best agreement with experiments.